Cloudy with a High Chance of Containers
Cloud computing is no longer a new idea but we are very much still in a period of transition for the organizations who previously had all their workloads hosted on-prem, with many moving services into virtualized systems in public cloud providers such as AWS. Beyond just moving servers to be VMs in the cloud, the architecture of services are changing too, with containerized microservices replacing monolithic software and the levels of abstraction between hardware running code and the end user is increasing.
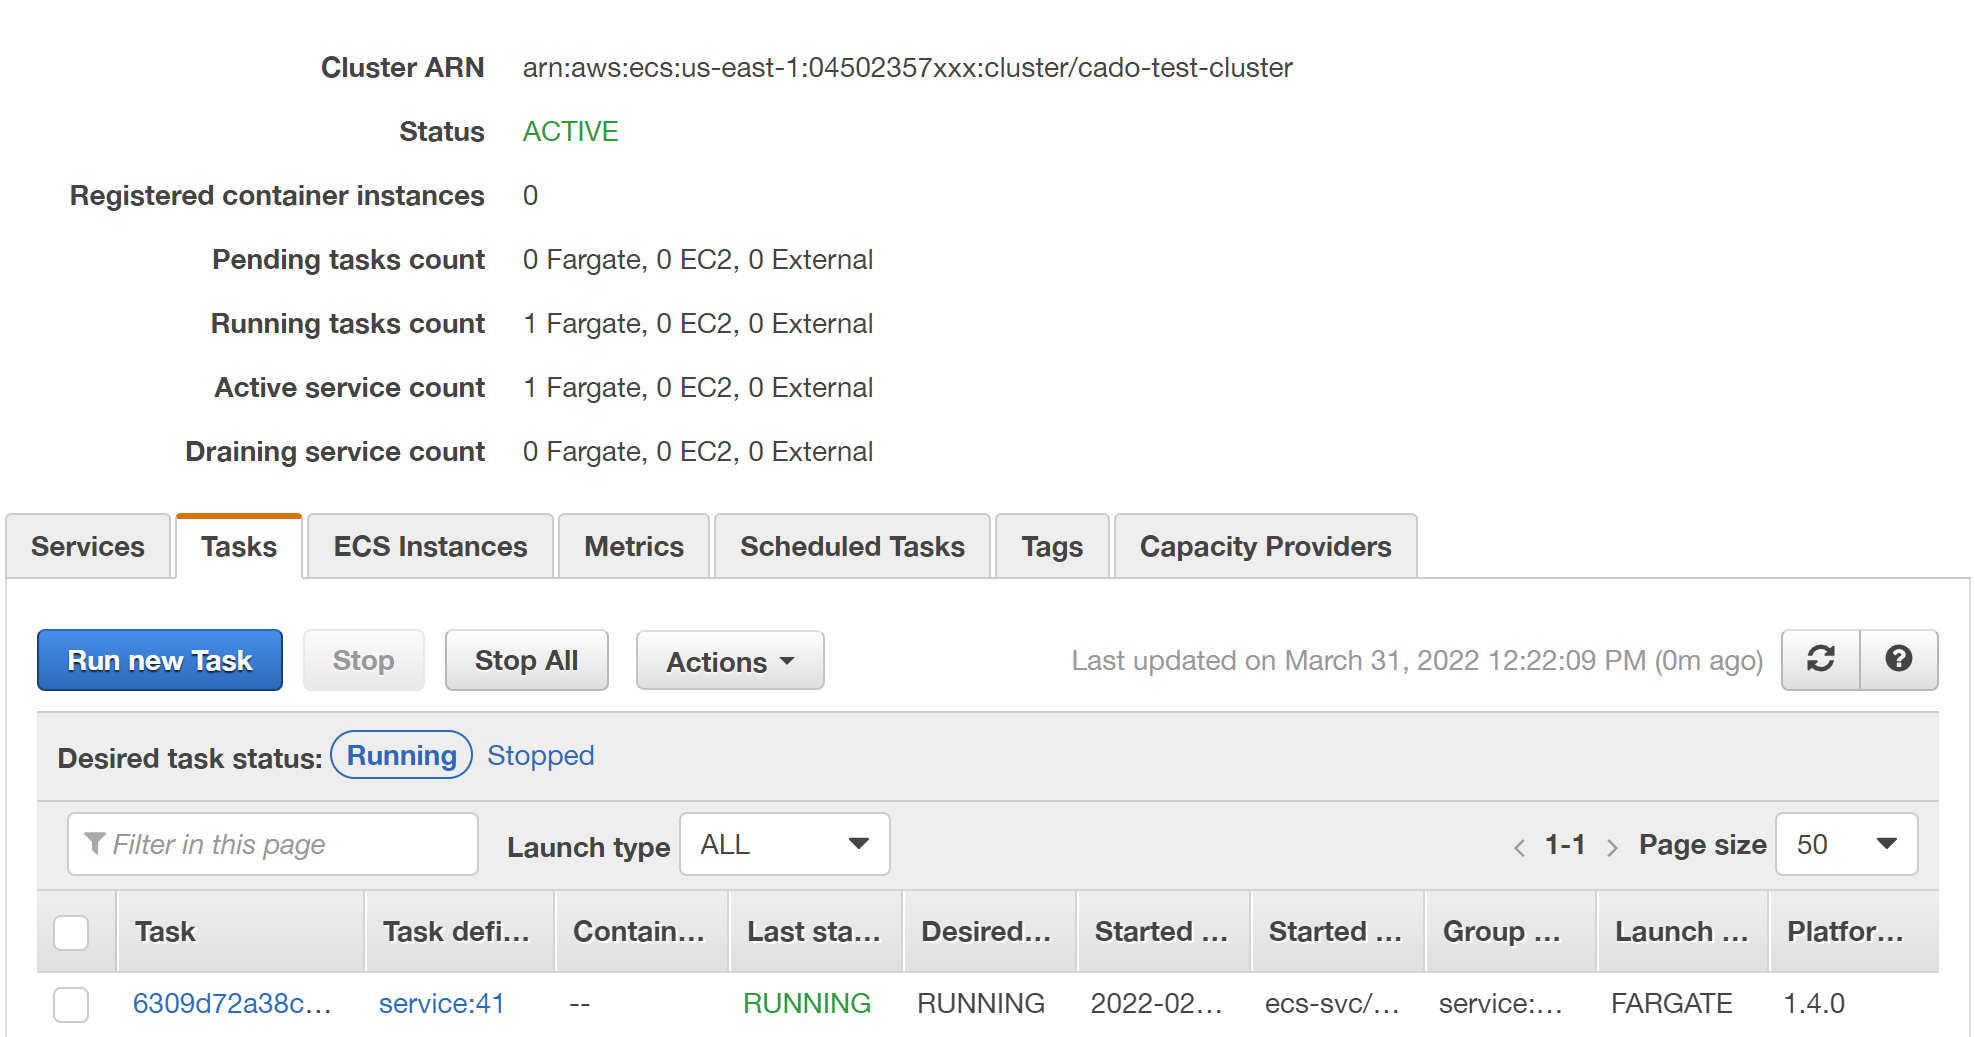
The appeal of managed cloud services which abstract away the server racks are easy to see, so more and more organizations are moving to the cloud. One popular example of a managed service is AWS Elastic Container Service, or ECS. ECS can be configured to use EC2 (AWS virtual machines managed by the customer), on-premises container hosts connected to AWS, or AWS’s fully managed Fargate as the underlying container host infrastructure. The fully managed nature of Fargate is fantastic to reduce time and money spent worrying about failing drives or configuring operating systems, but this lack of infrastructure management comes with an equal lack of access. This lack of access can add frustrations when the time comes to investigate an incident involving your containers.
Containers Under the Couch
An important aspect to an investigation is being able to tie information you gain from analysis to systems. For example, you find a network connection into a system just before malware is executed and know the source IP address, but which system uses that IP? Issues like this come up again and again in investigations and incident response situations, so having an up-to-date asset register or a way to quickly build this information is critical.
In the case of AWS ECS, you can view the services and containers under the ECS section of the portal, but what happens when your containers are spread across a couple of AWS accounts? What if you have tens or hundreds of accounts? When you combine the difficulty of discovering containers, services potentially containing large numbers of containers and that containers can be ephemeral and regularly spun up & down, investigating ECS containers is not so simple!

Pulling Back the Container Curtain
Once you have a handle on the containers you want to investigate, what’s next? If data collection wasn't baked into the container declaration before the need to investigate arose, you need to rely on data you can actively interrogate out of the container. In traditional digital forensics, taking a full disk image is generally the first step, but this doesn’t translate into the world of containers very well where containers are usually ephemeral with persistent storage kept separately in shared resources like managed databases, S3, etc.
If you’re using ECS on Fargate, taking an image of the running container or the container host isn’t an option as the underlying AWS infrastructure is shared with no access to the end customers.
So, what is available inside a Linux container that could help you build understanding in your investigation?
Perusing /proc

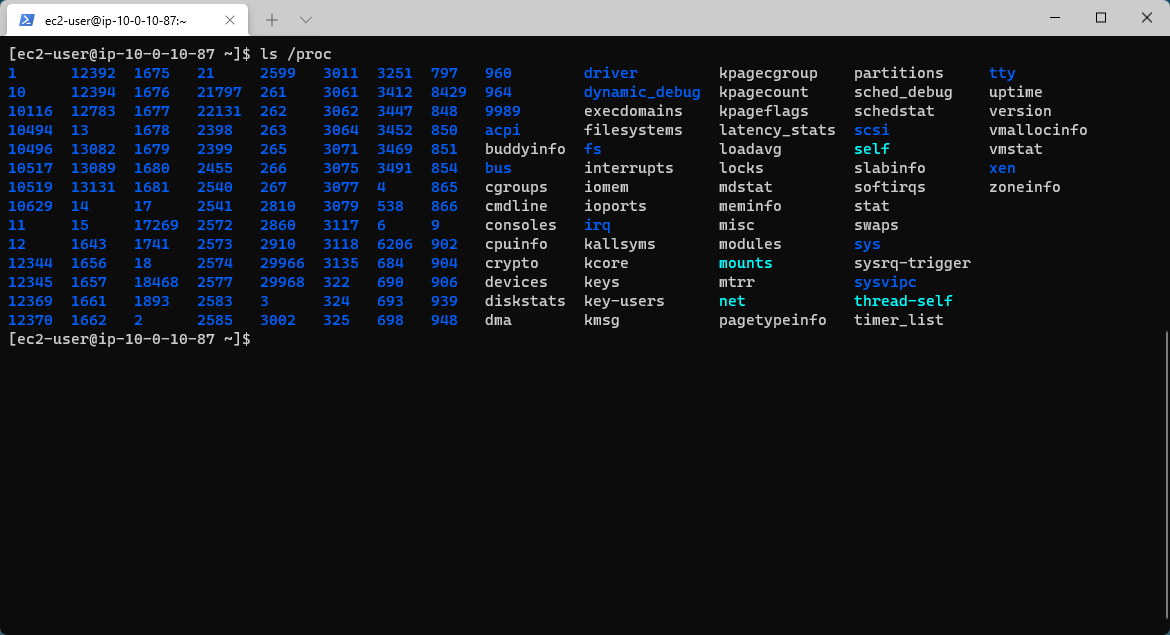
In Linux the /proc directory is located in the root of the system drive and following Linux’s approach of everything-as-a-file, contains virtual files which contain very useful information about what is going on in the container. Containers do not run as a complete operating system like virtual machines do, instead running in a fenced-off section of memory on the container host (see cgroups/control groups). Access from within the container to the host is restricted by the container runtime (e.g., Docker) so we don't have full access to the same items in /proc that we would do in a bare-metal install of Linux such as the memory of a chosen process.
The table below shows some of the more useful files to read from inside a container:
| File | Value |
| /proc | Provides a list of process IDs (PIDs) of processes running at the time of collection |
| /proc/stat | Provides Kernel boot time |
| prox/$pid/stat | For the PID, provides: start time (as offset of kernel boot time), process name, process parent ID (PPID), process state (e.g., running, sleeping, stopped etc) |
| proc/$pid/exe | Provides a pseudo-symbolic link to the process executable file |
| proc/$pid/cmdline | Provides the command line used to invoke the process |
| proc/$pid/net/tcp | Provides IPv4 TCP connection info for the PID |
| proc/$pid/net/tcp6 | Provides IPv6 TCP connection info for the PID |
| proc/$pid/fd | Provides file open handle info for the PID |
The /proc directory gives us a snapshot of the volatile state of the container, much like a memory dump. Using this ‘snapshot’ we can build a basic picture of what is going on in the container at that time such as running processes, active network connections, open files, etc. This data provides a foundation of what you need to correlate with other data sources such as firewall logs, network subnet flows, etc during an investigation to understand the actions carried out by an attacker.
Container Investigations with Cado Response
Using managed container infrastructure in the cloud certainly isn't without its challenges, despite the benefits of cost and scalability. At Cado Security, we’ve been particularly interested in the challenges associated with investigating containers, even more so those running on fully-managed infrastructure that the end user has no access to in an investigation.
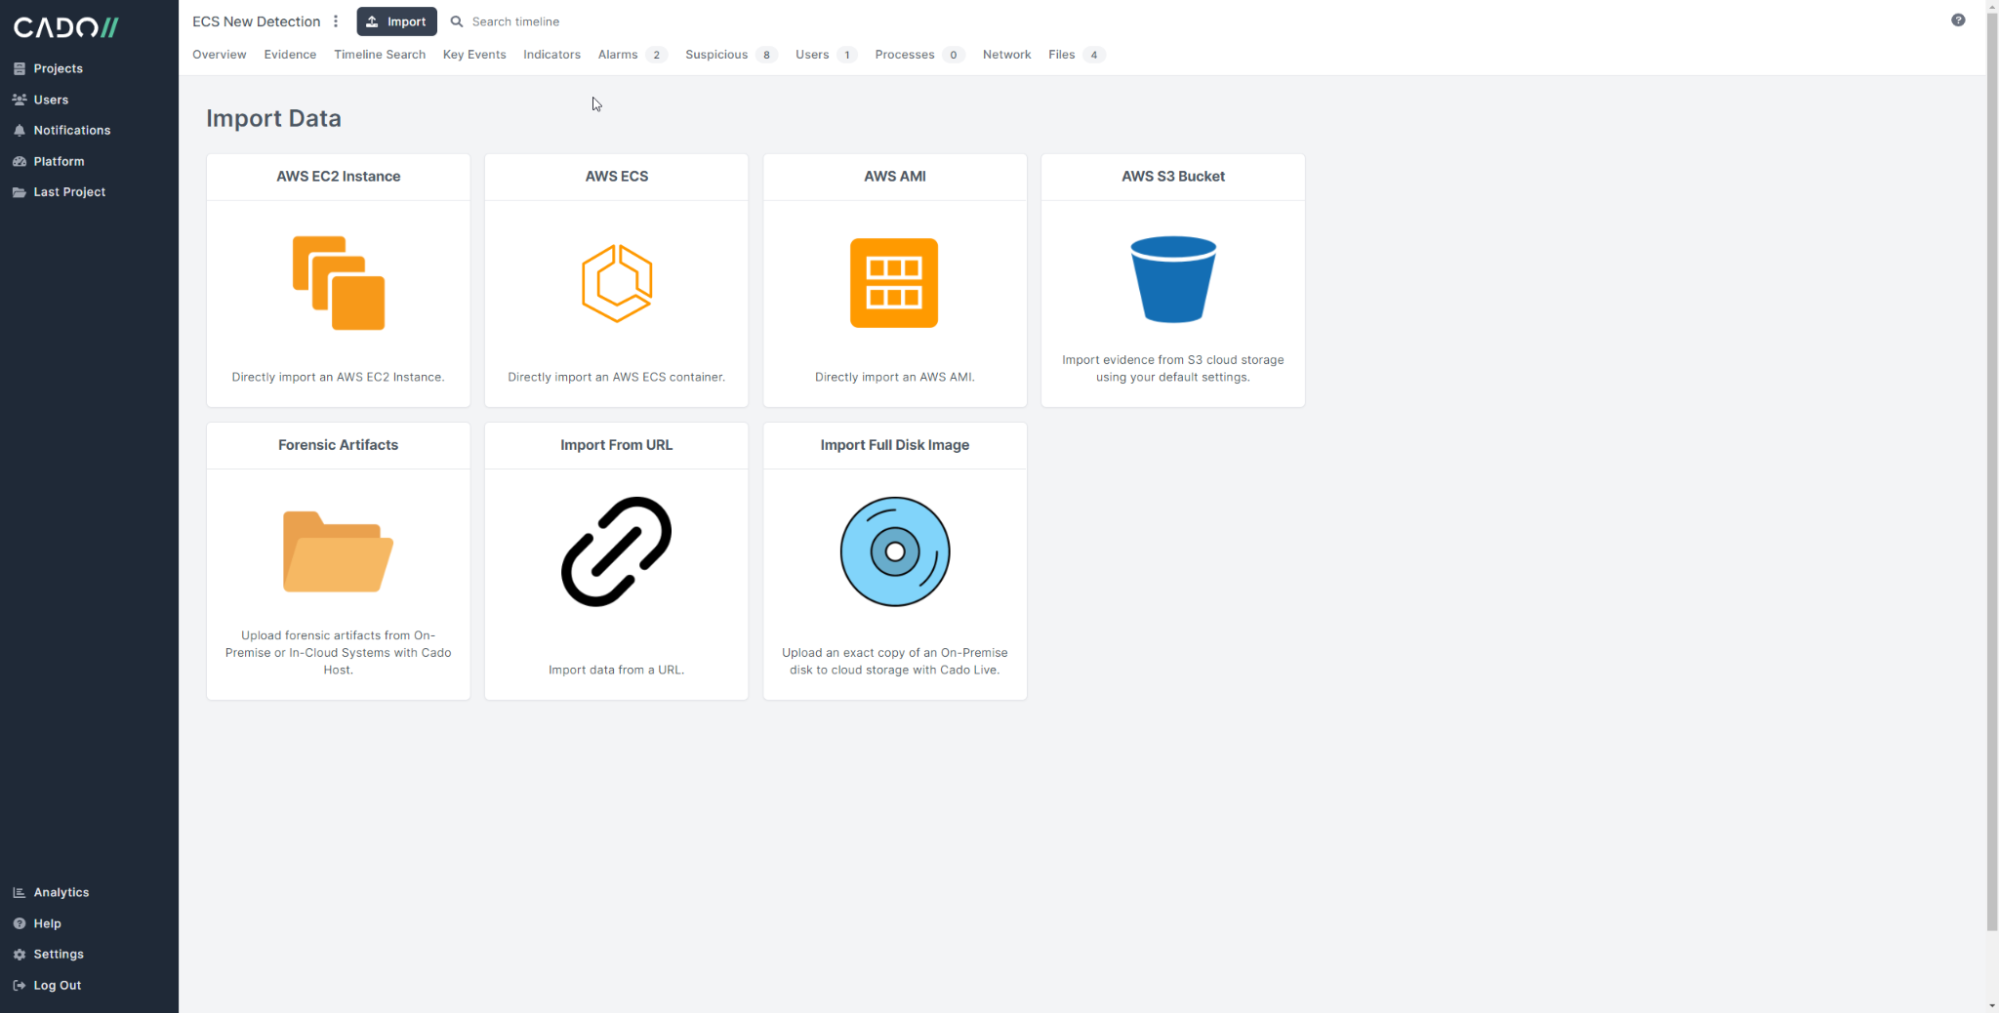
We’re proud to announce that as part of our latest release, Cado Response supports AWS Fargate to deliver enhanced context and visibility to support incident investigations. Check out a demo or do an investigation on your own using the Cado Response Free Trial.

More from the blog
View All Posts

Subscribe to Our Blog
To stay up to date on the latest from Cado Security, subscribe to our blog today.

