


In this ongoing series, "Decoding Logs in the Cloud," we've covered AWS CloudTrail, AWS VPC Flow Logs, and Azure Activity Logs. In this installment, we'll dive into Azure NSG (Network Security Group) Flow Logs, which are essential for monitoring network traffic within your Azure environment.
What are Azure NSG Flow Logs?
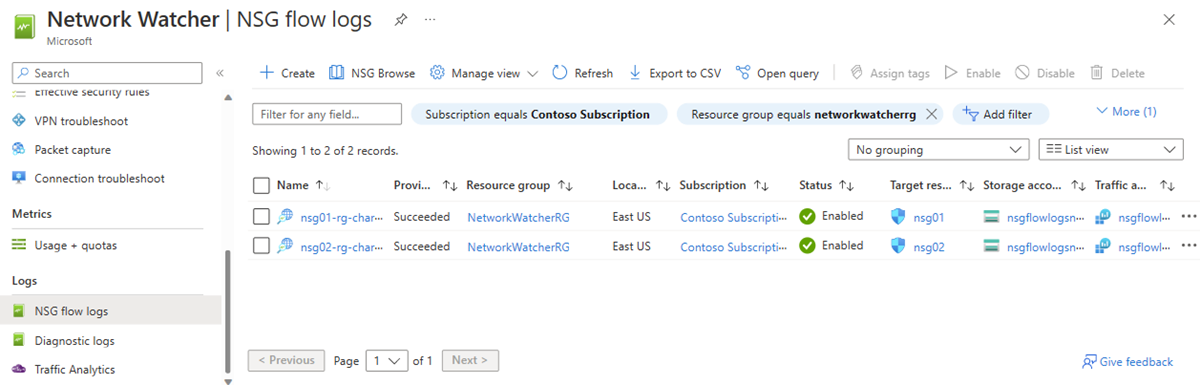
NSG Flow Logs
Azure NSG Flow Logs provide information about ingress and egress IP traffic through a Network Security Group. These logs help you understand traffic patterns, detect anomalies, and troubleshoot connectivity issues. NSG Flow Logs are part of Azure Network Watcher, a suite of tools for monitoring and diagnosing network issues in Azure.
Importance of Azure NSG Flow Logs
Azure NSG Flow Logs are crucial for:
Security Monitoring: Identifying unauthorized access attempts and potential security threats.
Network Performance: Understanding traffic flow to optimize network performance and identify bottlenecks.
Troubleshooting: Diagnosing and resolving connectivity issues by analyzing traffic data.
Compliance: Maintaining records of network traffic to meet regulatory requirements.
Structure of Azure NSG Flow Logs
Azure NSG Flow Logs are JSON-formatted records that capture various fields related to network traffic. Here are the primary components of an NSG Flow Log entry:
time: The timestamp of the log entry.
systemId: A unique identifier for the log entry.
mac: The MAC address of the network interface.
resourceId: The Azure resource ID of the network interface.
category: The category of the log entry (e.g., NetworkSecurityGroupFlowEvent).
operationName: The name of the operation (e.g., NetworkSecurityGroupFlowEvents).
version: The version of the log format.
properties: Detailed properties of the log entry, including flows.
The properties field contains detailed information about the network flows, including:
flows: A list of flow records, each representing a network flow.
rule: The name of the NSG rule that matched the flow.
flows: Detailed information about the traffic flow.
mac: The MAC address of the source/destination.
flowTuples: A list of flow tuples, each representing a traffic flow record.
Each flowTuple contains the following fields:
srcIp: The source IP address.
destIp: The destination IP address.
srcPort: The source port.
destPort: The destination port.
protocol: The protocol number (e.g., 6 for TCP, 17 for UDP).
traffic: The direction of traffic (e.g., I for inbound, O for outbound).
flowAction: The action taken by the NSG rule (e.g., Allow, Deny).
packets: The number of packets transferred.
bytes: The number of bytes transferred.
startTime: The start time of the flow in Unix epoch time.
endTime: The end time of the flow in Unix epoch time.
Example of an Azure NSG Flow Log Entry
Here is an example of an NSG Flow Log entry for reference:
{
"time": "2023-07-21T19:23:45Z",
"systemId": "12345678-1234-1234-1234-123456789abc",
"mac": "00-0D-3A-B6-7A-48",
"resourceId": "/subscriptions/abcdef12-3456-7890-abcd-ef1234567890/resourceGroups/myResourceGroup/providers/Microsoft.Network/networkInterfaces/myNic",
"category": "NetworkSecurityGroupFlowEvent",
"operationName": "NetworkSecurityGroupFlowEvents",
"version": "1",
"properties": {
"flows": [
{
"rule": "UserRule_Port_80",
"flows": [
{
"mac": "00-0D-3A-B6-7A-48",
"flowTuples": [
"1620382227,10.0.0.1,10.0.0.2,12345,80,6,I,A,10,840",
"1620382287,10.0.0.2,10.0.0.1,80,12345,6,O,A,10,840"
]
}
]
}
]
}
}
Analyzing Azure NSG Flow Logs
To effectively utilize NSG Flow Logs, you can:
- Centralize Logging: Store logs in Azure Storage, Azure Monitor, or a SIEM solution for centralized access and analysis.
- Automate Monitoring: Set up alerts and automated responses using Azure Monitor to detect and respond to suspicious traffic patterns.
- Visualize Data: Use tools like Azure Monitor Workbooks, Power BI, or third-party visualization tools to gain insights from your flow logs.
The Cado Platform
Cado Security empowers security teams to get to the bottom of what happened faster. With Cado, what used to take analysts days, now takes minutes. Automate data collection. Process data at cloud speed. Analyze with purpose. No confusion, no complexity.
Collect From Anywhere: whether it's a multi-cloud, container-based, serverless, SaaS, or on-premises set up. Automatically capture hundreds of data sources across cloud-provider logs, disk, memory, and more. No agent required means zero impact to production systems.
Cloud Native: Cado deploys natively within your cloud environment to ensure your unique data privacy requirements are met. You choose: deploy in AWS, GovCloud, Azure, or GCP in minutes, decreasing time to investigation and eliminating egress costs.
Powerful Analytics: Collected data is enriched using third-party and proprietary threat intelligence. Key incident details such as root cause, compromised roles and assets, and a complete timeline of events are automatically surfaced.
Azure NSG Flow Logs provide critical visibility into the network traffic within your Azure environment. By understanding their structure and significance, you can enhance network security, troubleshoot connectivity issues, and ensure compliance. In the next blog of this series, we'll explore another type of cloud log and continue our journey into decoding logs in the cloud.
Tag(s):
Cloud DFIR